A Wind Rose is a graphic tool/map that is used by meteorologists to determine wind speed and direction. The Data is usually taken in a particular location; this example is just a general depiction of the map.
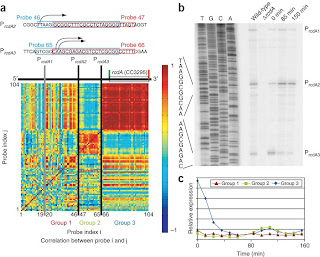
Defined as Non specified class of statistical relationships between two or more random variables or observed data values. This example is a correlation matrix displaying some cell cycle data.
A star plot is a graphical data analysis technique for examining the relative behavior of all variables in a differebt variable data set (Each spoke representing a dfferent variable). This one particular anlayzis buicks in 1979.
Proportional map circles are usually used by travel agencies to link locations for tourist. This is an example of Europe Lab Circles, linking individual countries throughout the continent.
Infrared maps are aerial visuals typically used to track weather changes. This particular picture is linked to the air force and is a over view of a region in East Africa.